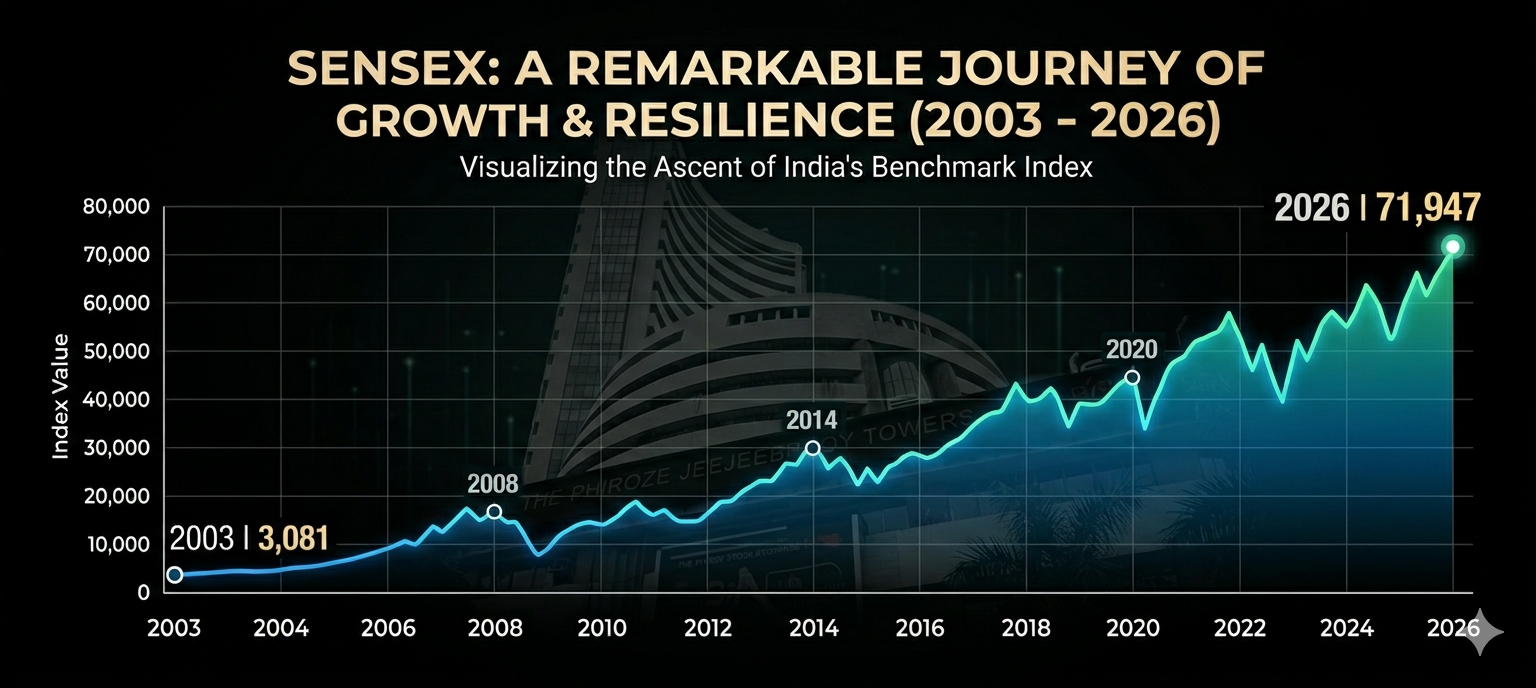
Journey of Sensex (2003-2026): 23 Years of Market Analysis
April 2nd, 2026
| Journey of Sensex in Financial Years |
| Start Date |
Sensex (Start) |
End Date |
Sensex (End) |
Gain/Loss |
| 01-04-2003 |
3,081 |
31-03-2004 |
5,591 |
81.46% |
| 01-04-2004 |
5,741 |
31-03-2005 |
6,493 |
13.10% |
| 01-04-2005 |
6,605 |
31-03-2006 |
11,280 |
70.78% |
| 03-04-2006 |
11,564 |
30-03-2007 |
13,072 |
13.04% |
| 02-04-2007 |
12,455 |
31-03-2008 |
15,644 |
25.60% |
| 01-04-2008 |
15,627 |
31-03-2009 |
9,709 |
-37.87% |
| 01-04-2009 |
9,902 |
31-03-2010 |
17,528 |
77.01% |
| 01-04-2010 |
17,693 |
31-03-2011 |
19,445 |
9.91% |
| 01-04-2011 |
19,420 |
30-03-2012 |
17,404 |
-10.38% |
| 02-04-2012 |
17,478 |
28-03-2013 |
18,836 |
7.77% |
| 01-04-2013 |
18,865 |
31-03-2014 |
22,386 |
18.67% |
| 01-04-2014 |
22,446 |
31-03-2015 |
27,957 |
24.55% |
| 01-04-2015 |
28,260 |
31-03-2016 |
25,342 |
-10.33% |
| 01-04-2016 |
25,270 |
31-03-2017 |
29,621 |
17.22% |
| 03-04-2017 |
29,910 |
28-03-2018 |
32,969 |
10.23% |
| 02-04-2018 |
33,255 |
29-03-2019 |
38,673 |
16.29% |
| 01-04-2019 |
38,872 |
31-03-2020 |
29,468 |
-24.19% |
| 01-04-2020 |
28,265 |
31-03-2021 |
49,509 |
75.16% |
| 01-04-2021 |
50,030 |
31-03-2022 |
58,569 |
17.07% |
| 01-04-2022 |
59,277 |
31-03-2023 |
58,992 |
-0.48% |
| 03-04-2023 |
59,106 |
28-03-2024 |
73,651 |
24.61% |
| 01-04-2024 |
74,015 |
31-03-2025 |
77,415 |
4.59% |
| 01-04-2025 |
76,025 |
30-03-2026 |
71,947 |
-5.36% |